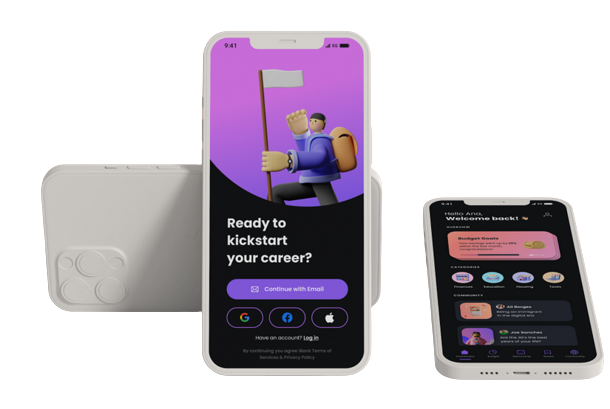
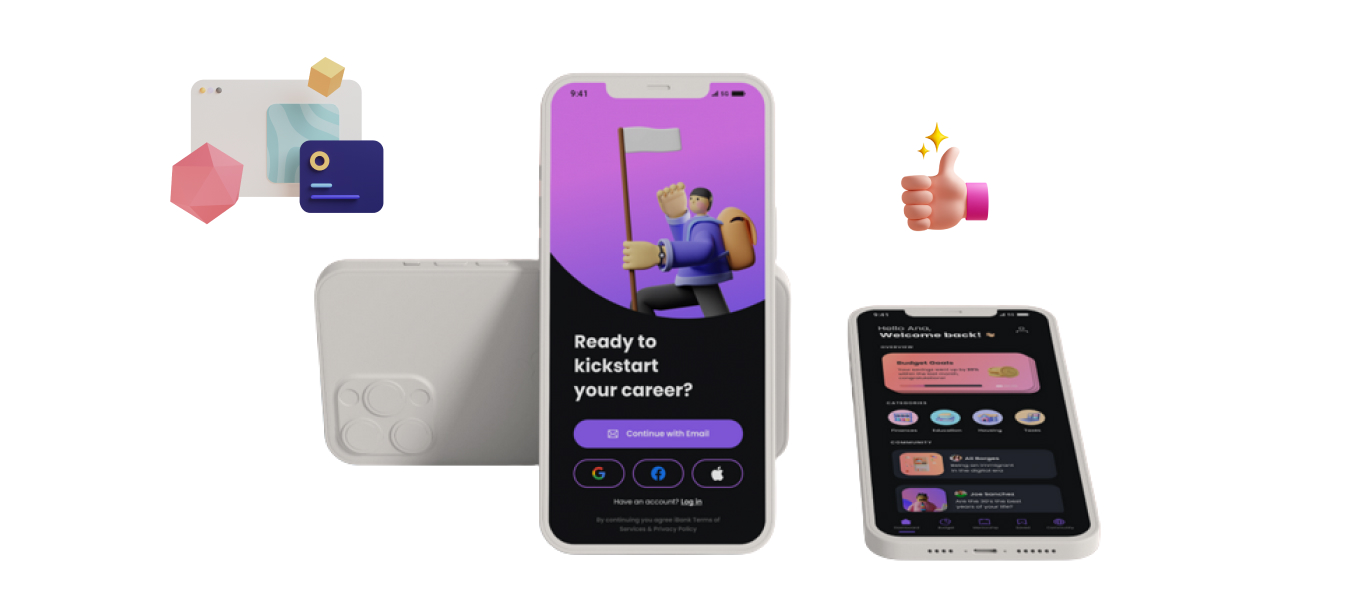
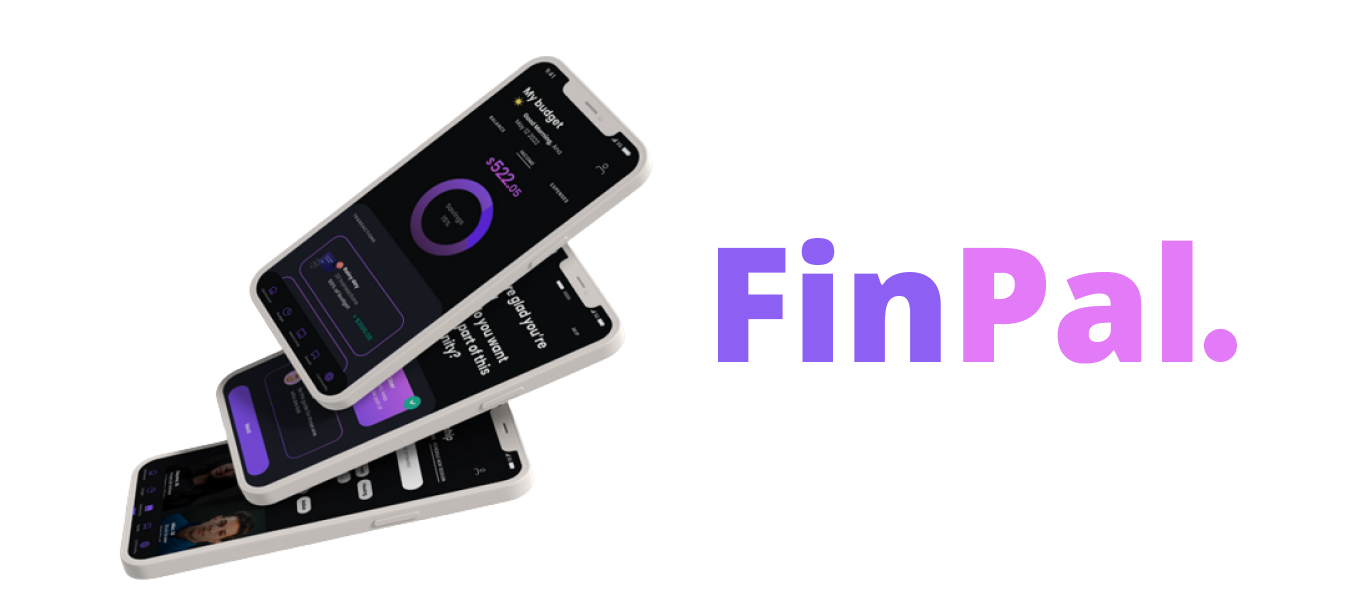
FINPAL
Type : AppClient : AvocademyRole : Product Designer- FinPal
Description
OVERVIEW
This prototype was made as an entree for a designathon by avocademy. Finpal was a collaborative project developed in 5 days. This taught me delegation, communication and collaboration.
We wanted to create a FinTech app that helped the community, dedicated especially to young immigrants, and young adults, to organize their credit life, own a house, and get it together.
As a process, we started with research all over the internet to get statistics on how young adults manage their money, how immigrants built a credit life starting a new life, then we asked people that was our target user to get more information, more insights. It's supposed to be an all-in-one tool that combines financial literacy and resources that are helpful for anyone who looks to kickstart their career but doesn't know where to start, especially growing up in a different environment (outside the U.S.). Since immigrants are the largest "minority" in the U.S., and sadly there is a big economic and professional gap as opposed to naturally born American citizens, this app strives to be a bridge between young adults and meaningful careers, and bring the necessary tools for anyone who wants to improve their quality of life, in one tap.
THE CHALLENGE
To empower young adults, so they can kickstart they careers; improve finatial and fiscal literacy and provide an usefull tool that can adapt to their short and longterm milestones.
The Process
DESIGN PROCESS
1. Empathize : User Persona, journey map, empathy map.
2. Define : Research Analyze, affinity map, defined the user and creating the problem statement.
3. Ideate : User Flow, low-fidelity wireframe.
4. Build : Wireframes, visual brading, protyping.
5. Test : Run an usability test.
EMPATHIZE
RESEARCH
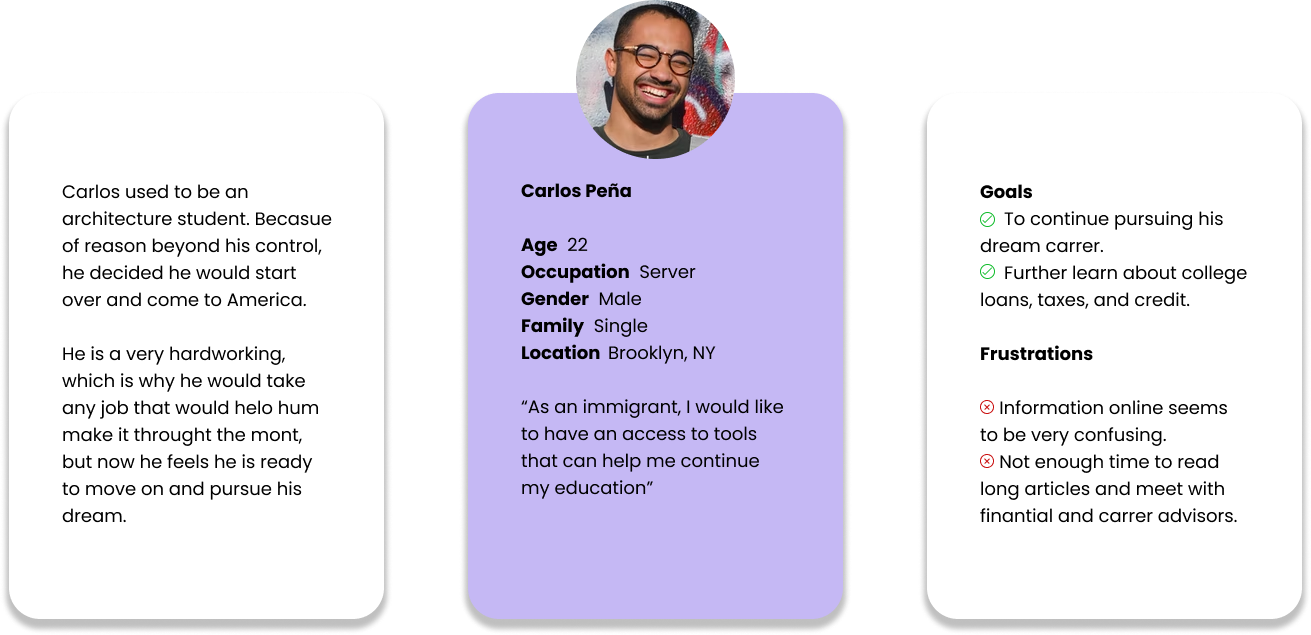
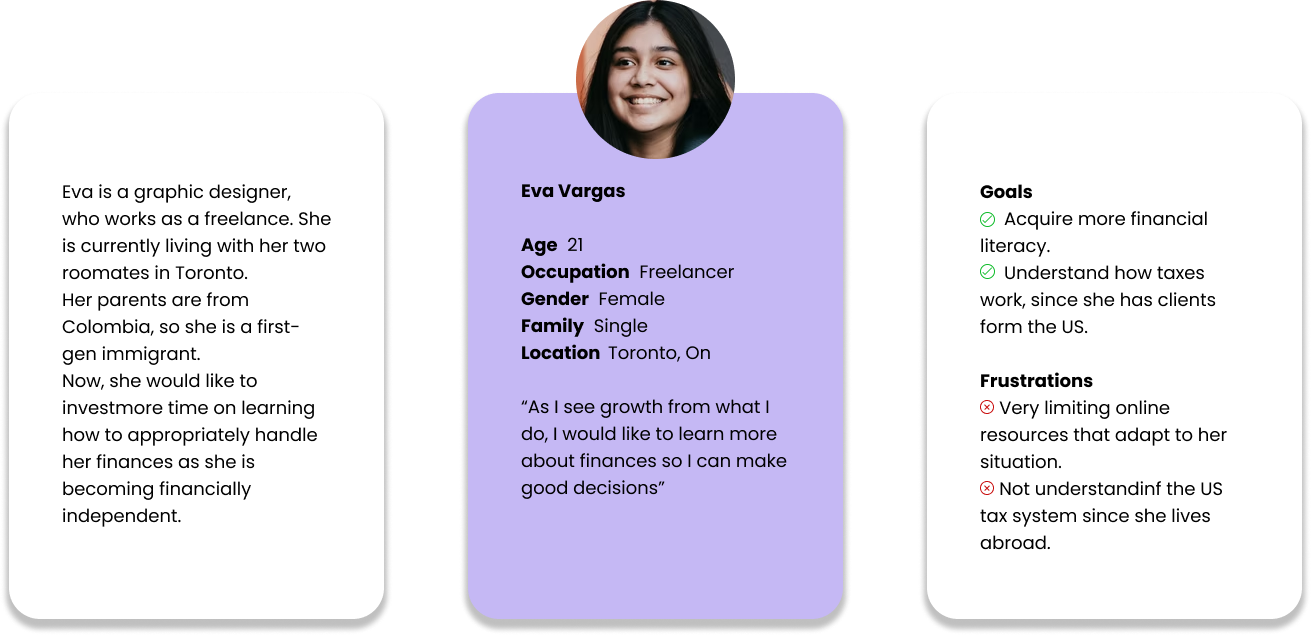
TARGET USER, RESEARCH AND FINDINGS
THE PROBLEM
United States is the country with the largest amount of immigrants worldwide.
Currently, more than 40 million people living in the U.S. were born in a different country,
which translates to 1/5 of the world’s migrants. Today, immigrants account for
over 44.8 million (data from 2018), holding a record since 1965, which adds up to a
13.7% of the total U.S. population.
After gathering some data through secondary data analysis, we've concluded that:
At least 66% of immigrants (ages 16 or more) are actively in the labor force, however, the median annual personal earnings aren't usually above $31,900.
14% are living in poverty, and 19% are uninsured.
Regarding higher education, only 18.8% have acquired a 2-year degree, and 32% have earned a Bachelor's degree.
This just shows that overall the access to higher education and financial literacy is not only an obstacle for natural citizens, but it's even more of an obstacle for young immigrants and first-generation immigrants that wish to achieve common adulthood milestones, and have not done so because of a language barrier obstacles and/or lack of access to information with ease.
Data Source: U.S. Census Bureau, “Historical Census Statistics on the Foreign-Born Population of the United State: 1850-2000" and Pew Research Center tabulations of 2010 American Community Survey (IPUMS)
THE SOLUTION
This is why we thought it is imperative to offer a service that extends resources for young immigrants that want to pursue a higher education degree, learn about taxes (plus other important topics) and improve their quality of life.
LOW FIDELITY WIREFRAMES
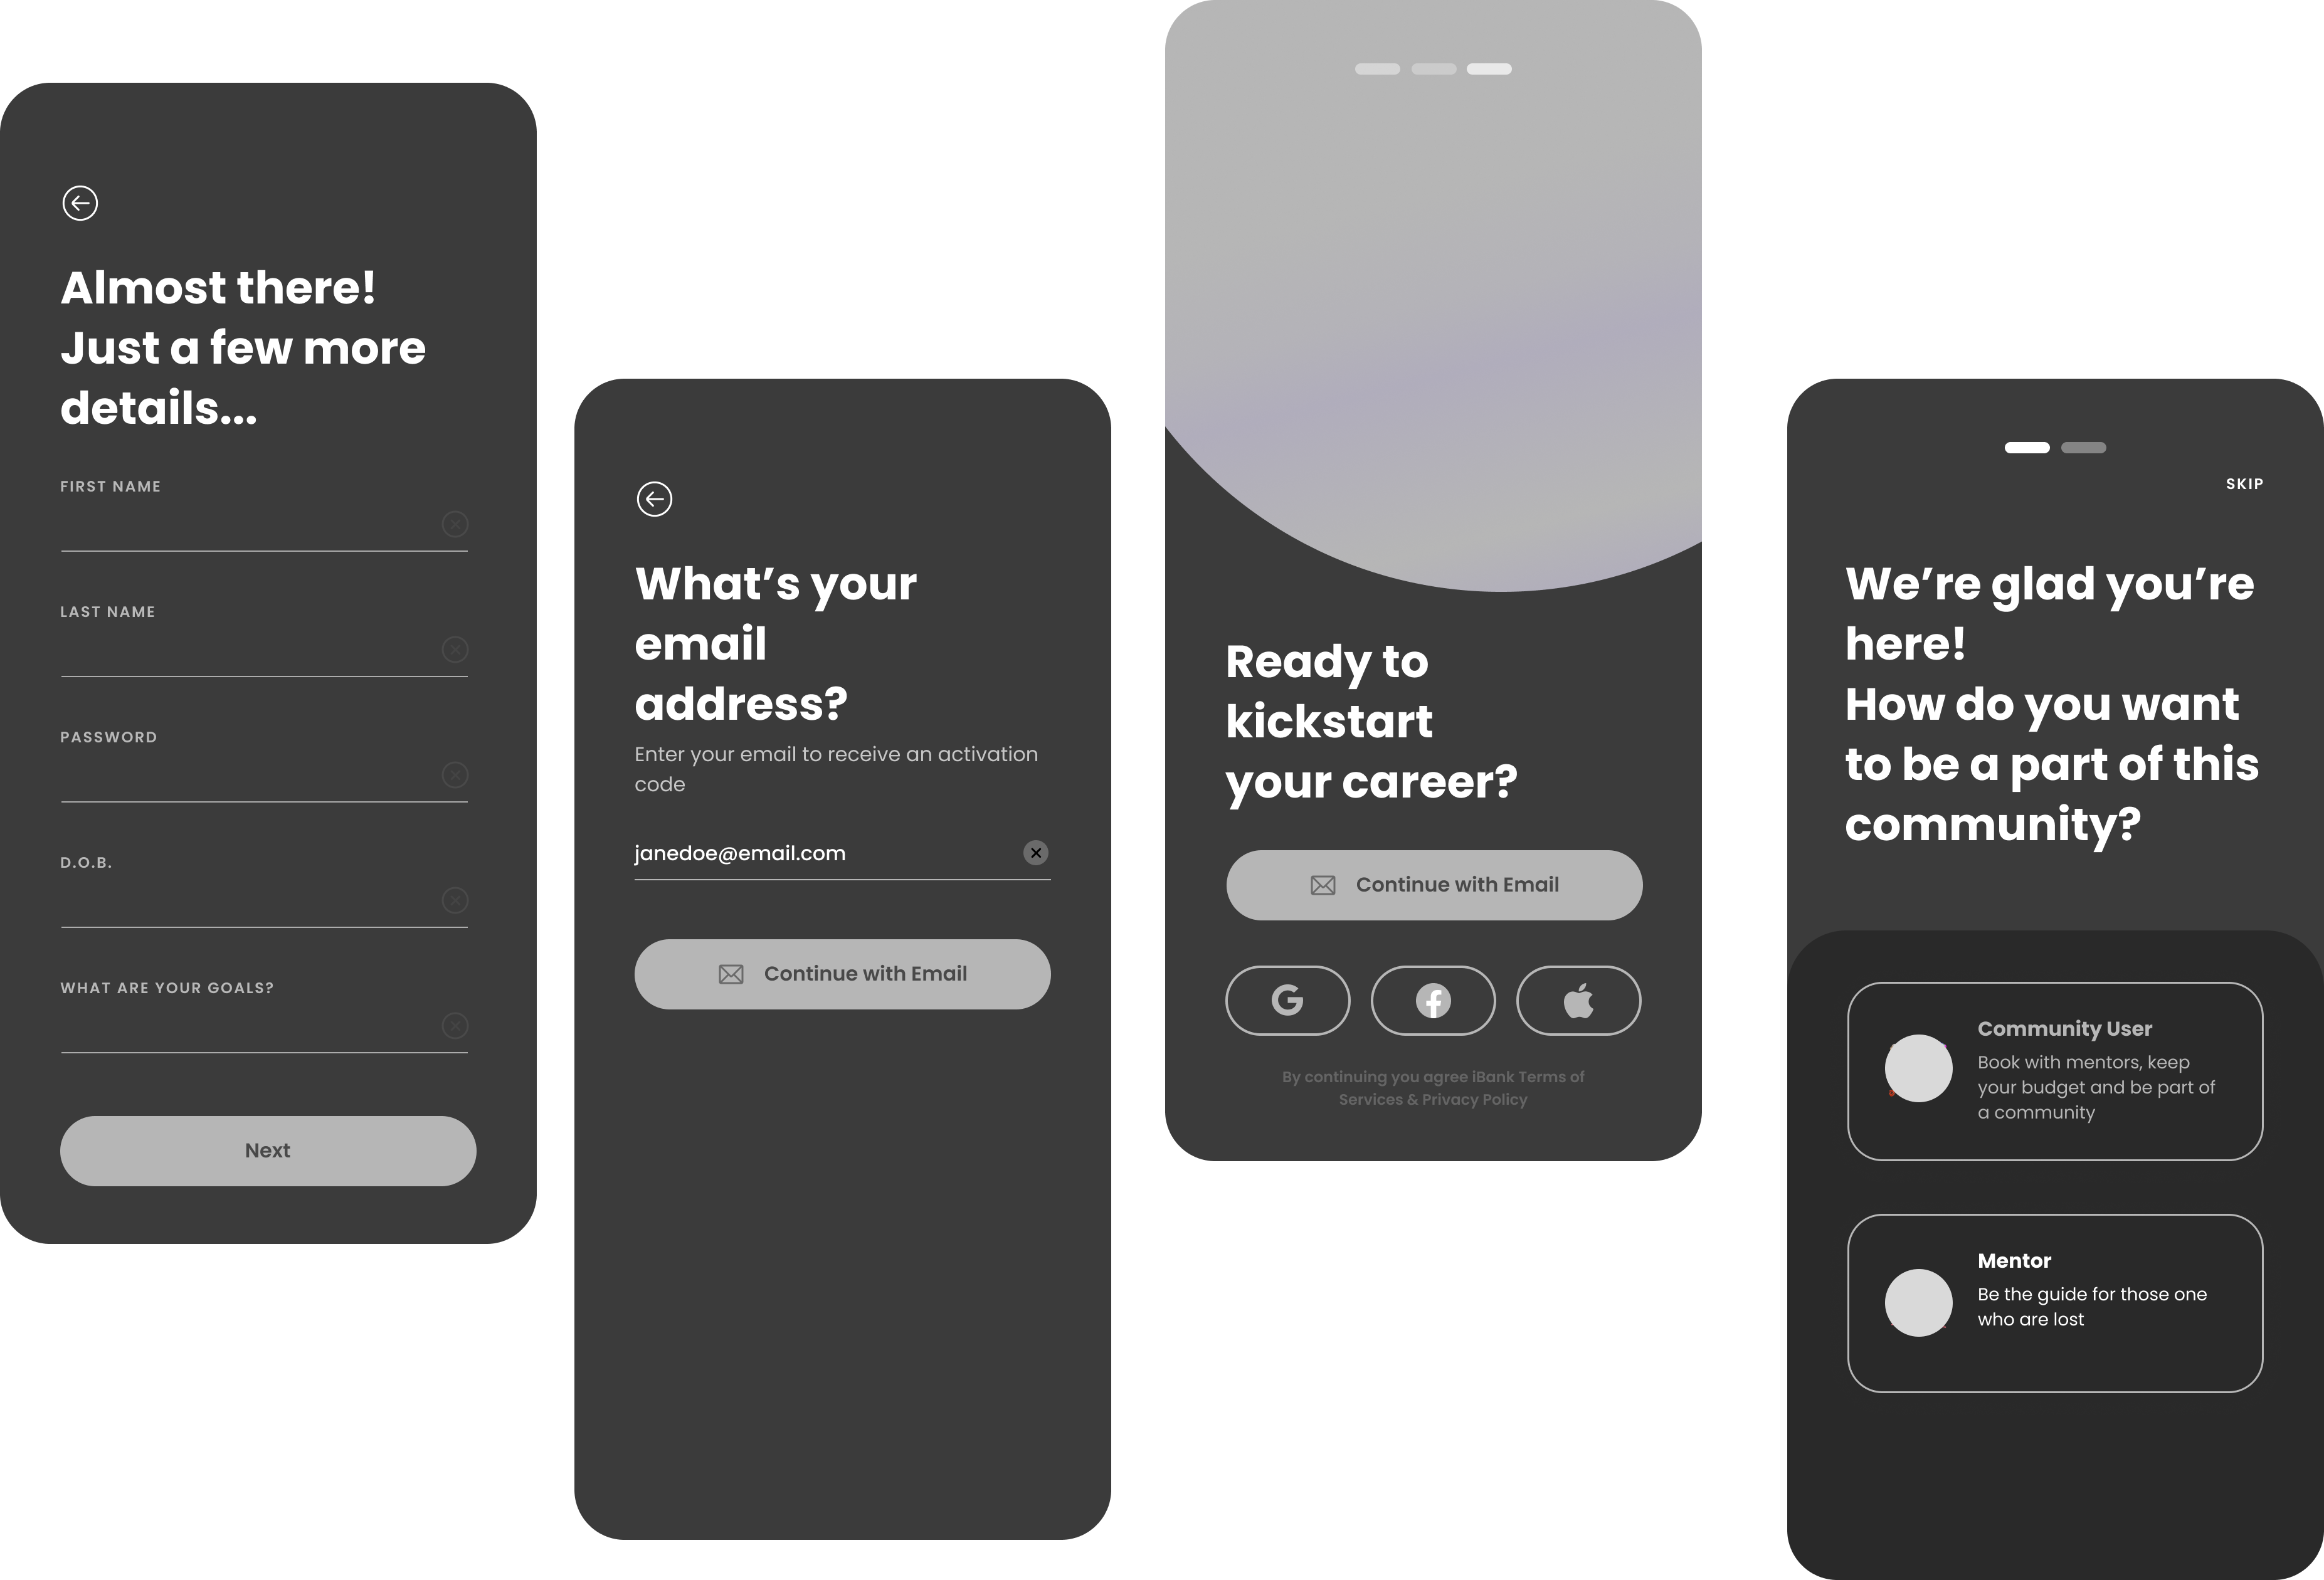
We began designing low-fidelity wireframes for the main flow once the flow diagram was established. We decided to use a dark theme to enhance accessibility.
FINAL MOCKUPS
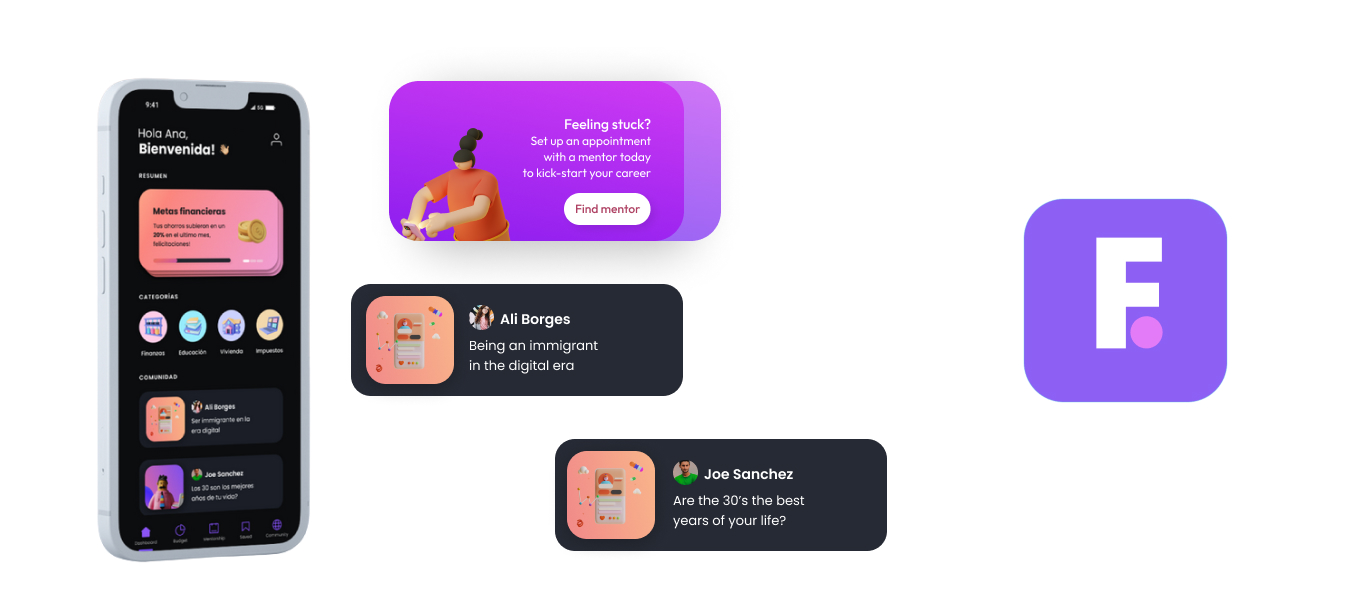
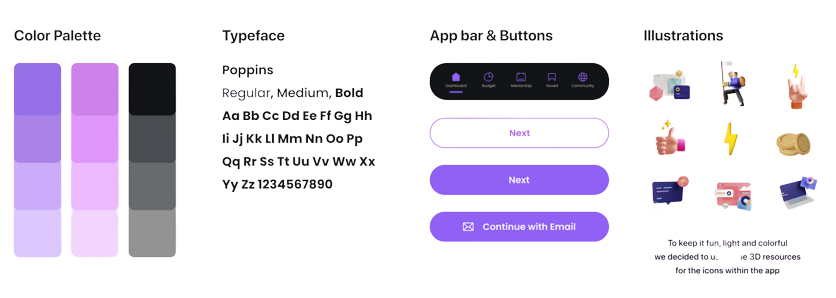
We wanted go with a dark-theme design, so we designed the color palette, using contrasting colors such as pink, magenta, and purple to emphasize certain elements such as buttons (call to action), titles, menu bar, and borders.
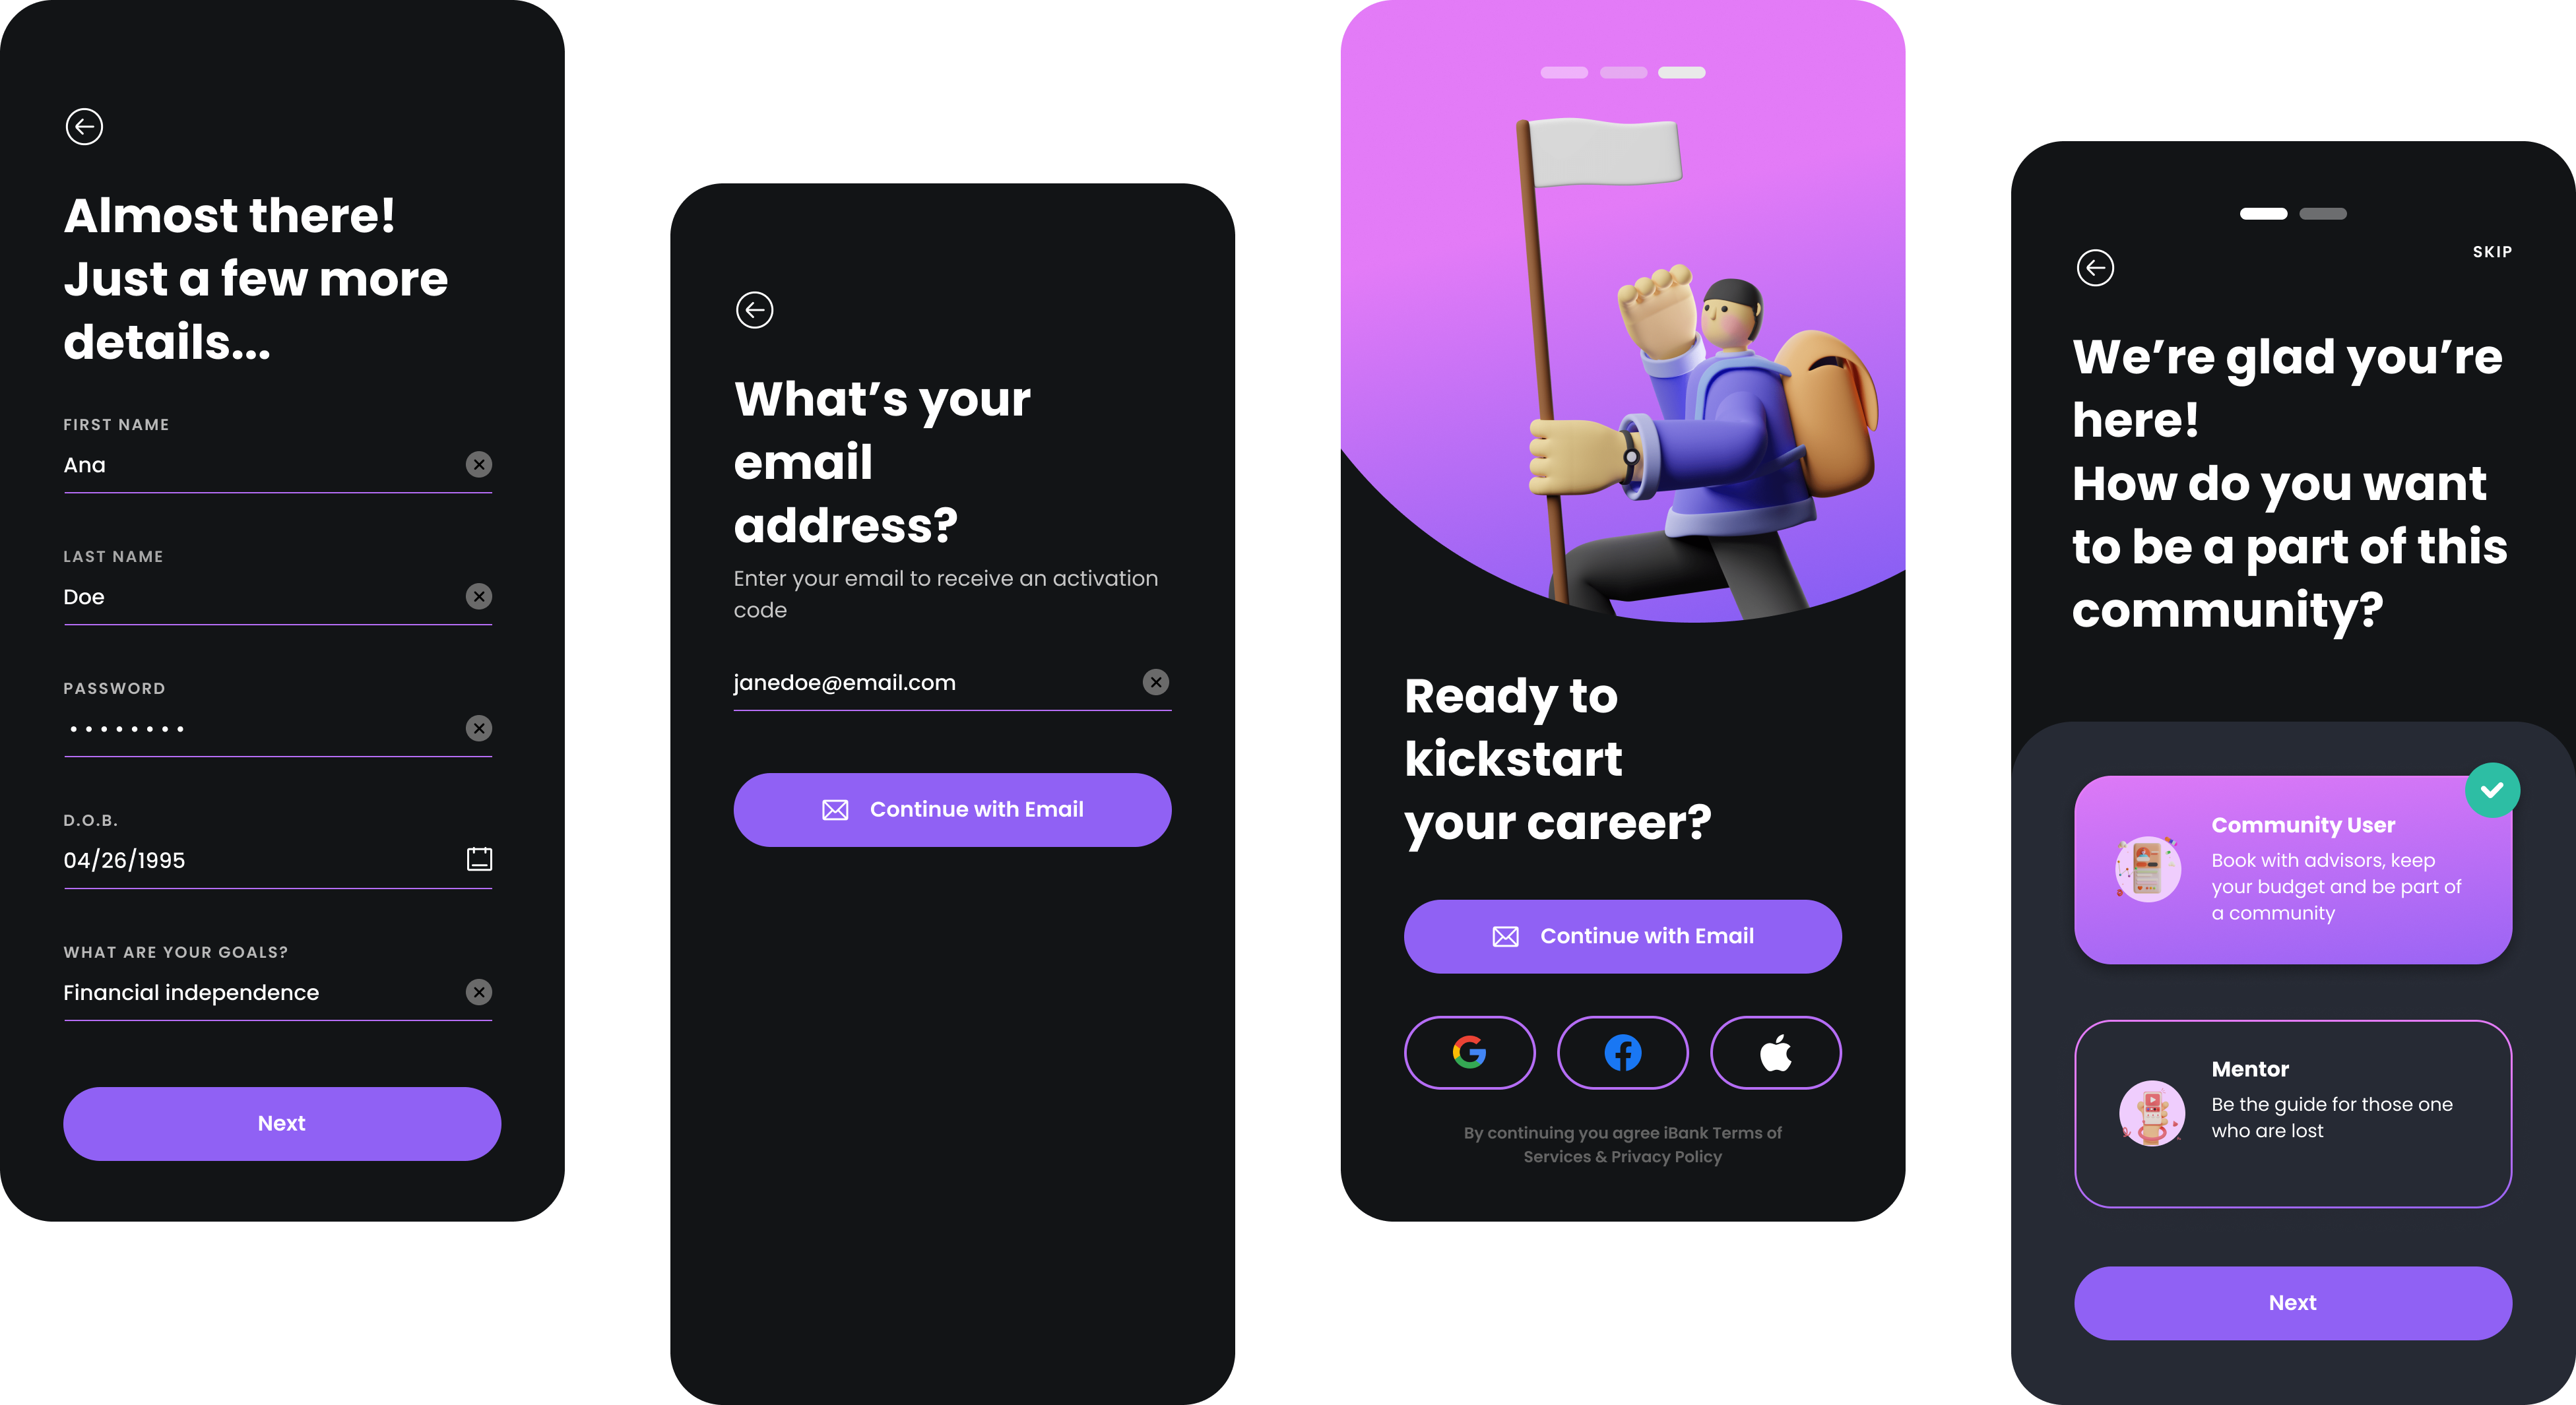
THE STYLE GUIDE
USABILITY TESTING
After having high-fidelity wireframes, we made it into a working prototype. This was tested among 9 users, using the tool Maze. The tasks were simple, to find the Budget Dashboard, and schedule a Session with a mentor. After gathering insights, we made an affinity diagram, and applied user feedback to make the app more intuitive and easier to use.
RESULTS
We found out that 100% of the users were able to find the Budget Dashboard , however, only 4/7 did so with ease. This translated into adding names to each category of the menu , instead of relying on icons alone. Likewise, 100% of users were able to schedule a session with a mentor, and all of the tested users highlighted the intuitive user flow and appealing UI, which could mean a good number of user retention upon app release.
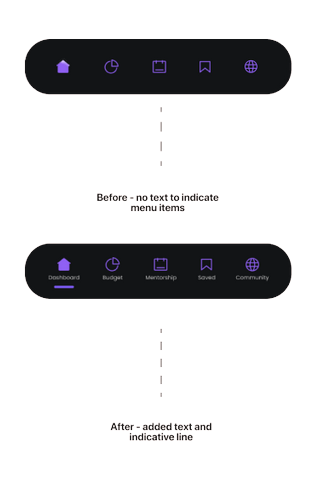
ACCESSIBILITY
To enhance accessibility, we decided to use a dark-themed interface. Likewise, since our app is aimed especially toward young immigrants, we have added a multi-language functionality that allows users to switch languages within the app, this time we decided to release it in English and Spanish, since this tackles our biggest demographic. We've also implemented a color palette and Ul that follows the a11y guidelines, with a contrast ratio of 4:5:1.
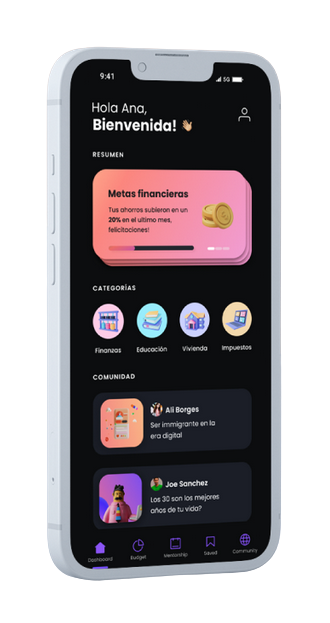
PROTOTYPE
TAKEAWAYS
This was my first designathon and it was so fun. With a tight deadline, I had to put into practice skills like communication, delegation, trust, and teamwork. It was a good experience, meeting new people, guiding sometimes to the process and research for people in our situation. Also trying to help people and users with innovative products.
